

For years, the final score was all that mattered. A win was a win, and a loss was a loss. But now, we see the game in a whole new way.
Modern gaming analytics have changed the game. They let us dive deep into every detail. We’re not just counting wins anymore; we’re analyzing the game’s inner workings.
True mastery in competitive gaming is more than just the final score. It’s about the data behind every action. Modern gaming analytics have moved us beyond simple stats.
They let us see the game at a molecular level. We can now analyze the operational DNA of a player or team. We’re not just counting wins anymore; we’re diving deep into victories and losses.
A 0.2-second delay in a clutch moment can decide a championship. Esports analytics tools can spot these tiny details. They reveal inefficiencies that are invisible on a standard stat sheet.
This isn’t just data; it’s an X-ray of your gameplay. It shows the exact cause of a loss. It’s the difference between knowing you lost a duel and understanding the exact reason.
This isn’t about more spreadsheets; it’s about actionable intelligence. It’s the difference between a generic “play better” and a specific plan. A coach can say, “Your average reaction time in the first 30 seconds of a round is 0.15 seconds slower than in the final minute. Let’s work on your initial positioning and focus.”
This is the kind of deep, strategic insight that turns data into wins. We explore this in depth in our guide to pro-level strategies and team dynamics.
So, forget the binary. Winning and losing are just the cover of the book. The real story—the one filled with micro-decisions, split-second reactions, and strategic depth—is written in the data. Let’s start reading.
Heatmaps and positional data
Forget the scoreboard for a second. The real story of your last match isn’t in your kill/death ratio. It’s painted in a vibrant, often incriminating, color-coded map of your every move. Welcome to the world of positional data, where the map isn’t just a battlefield; it’s a behavioral analyst’s couch.
Your heatmap isn’t a report card—it’s a confession. It doesn’t just show where you died; it reveals where you lived, and more importantly, how you lived there. It’s the ultimate tool for understanding the spatial intelligence—or lack thereof—in your gameplay.
Decoding the Map: What Heatmaps Really Show
Heatmaps are often mistaken for simple death maps. A bright red blob at a choke point is a mass grave, a testament to a failed push. But the seasoned analyst looks deeper. A heatmap is less about the final, fatal moment and more about the 30 seconds of positioning that led to it.
Are you, as Guy Kroupp notes in his analysis of game, consistently holding an angle that gives you a 5% vision disadvantage? Your heatmap will whisper the answer before your K/D ratio ever gets a chance to scream it.
These game stats tools reveal not just the “where,” but the “how long” and “how often.” That faint, persistent glow in a rarely-used flank route isn’t a mistake; it’s a habit. It’s you, every single round, checking that one angle from that one crate, a routine so ingrained you don’t even see the sniper’s glare from the window you’re exposing.
The heatmap doesn’t lie. It shows the milliseconds of hesitation, the slight over-peek on your T-side push, the predictable re-peek from the same angle after a death. It translates your gut feelings about a “cursed” map into cold, hard, actionable data.
Spatial Analysis and Map Control
This is where heatmaps evolve from a post-mortem tool to a strategic oracle. It’s not about where you died, but where you exerted control—or failed to. A true spatial analysis asks: are you controlling a zone, or just occupying a pixel on the map?
A heatmap can reveal if your team’s “map control” is a thin veneer over a chaotic scramble. Are you consistently losing control of a critical chokepoint? The heatmap will show a glaring cold spot, a void of your team’s influence, right where the enemy team’s data will likely show a hot zone of activity.
This is the power of game stats tools; they move the conversation from “I think we lost mid control” to “Our heatmap shows a 70% enemy activity in mid during the first 45 seconds. We’re losing the information war before the first shot.”
Consider the following data a typical heatmap analysis might reveal about two different playstyles on the same map:
| Map Position | Aggressive Entry Player (Heatmap: Concentrated, Hot Zones) | Passive Support Player (Heatmap: Diffuse, Spread) | Strategic Implication |
|---|---|---|---|
| Mid Lane Control | Intense, focused heat at first contact points. Fast, hot “spike” at common entry points. | Broad, cooler coverage, indicating holding passive angles and watching flanks. | Aggressive player’s heatmap shows where the fight *starts*. Support player’s map shows where threats *could come from*. |
| Bombsite Defense (CT Side) | Hot zones at common entry points; quick to engage. | Warmer zones at fallback and crossfire positions. | Aggressive player’s heat is about first contact; support’s heat is about repositioning and information. |
| Rotation Paths | Hot, direct lines between key points. | Warmer, more circuitous paths with more diffuse heat trails. | Aggressive player rotates to the fight; support player’s route is about safety and info gathering. |
This table isn’t about good or bad. It’s about patterns. The aggressive player’s heatmap looks like a lightning strike—focused, direct, and explosive. The support player’s looks like a slow-burning, widespread brushfire.
The game stats tools that generate these visualizations don’t judge which is better; they show you the undeniable, colorful truth of your in-game footprint. The heatmap, therefor, becomes less of a post-game autopsy and more of a strategic planning tool. It tells you not just where you are, but where you aren’t, and that is often the more critical piece of intelligence.
Reviewing personal match data
Forget the final scoreboard for a moment. The real story of your last match isn’t just the win or loss. It’s in the thousands of data points you generate every minute. Your kill/death ratio is just the headline; the real narrative is in the footnotes.
We’re moving beyond the K/D/A to the granular, the micro-decisions, the split-second hesitations, and the hardware whispers. This is where the esports analytics tools stop being a scorekeeper and start being a personal coach. It’s not about how you died, but the 200 milliseconds of mouse jitter that made you miss the flick shot.
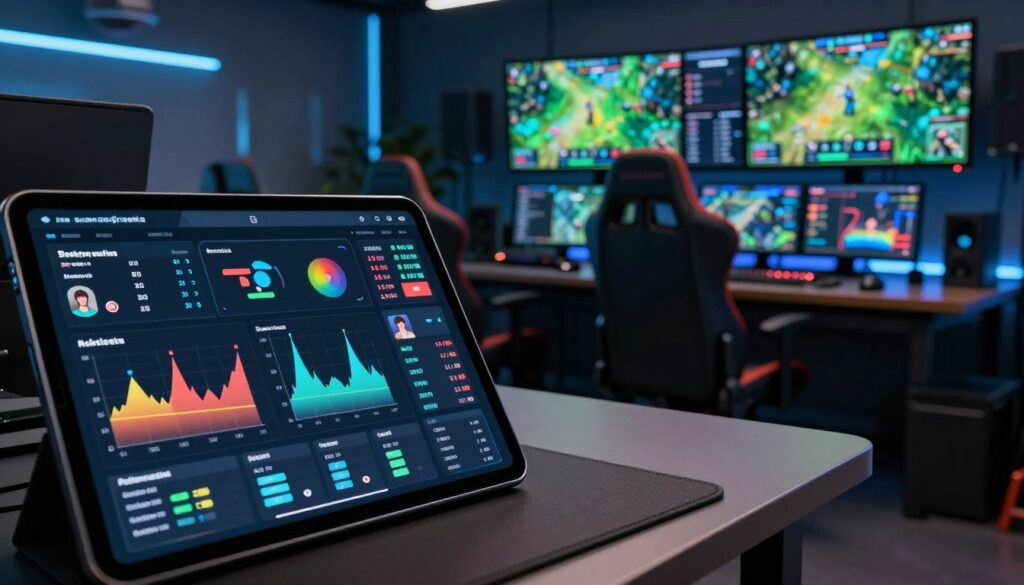
Your in-game stats are the “what.” Your hardware and behavioral data reveal the “why.” It’s the difference between knowing you lost a duel and understanding that your average reaction time increased by 22% after 90 minutes of play, as your session length data clearly shows.
From Raw Numbers to Actionable Insights
Raw data is just noise. An average accuracy of 35% is just a number. But when you layer it with other metrics, it starts to sing. Say your headshot percentage is a solid 45% for the first hour of a session, then plummets to 18% in hour three.
That’s not a “git gud” moment; it’s a data point screaming about focus fatigue or waning concentration. Tools like the LORGAR PLATFORM go deeper, tracking everything from click accuracy and movement speed to the exact moment your in-game economy decisions go off a cliff. Did you waste 30% of your in-game gold on a bad back-timing, as some esports data analysis might reveal? Your dashboard knows.
Interpreting Your Performance Dashboard
Think of your performance dashboard not as a report card, but as a detective’s case file. It’s not there to judge, but to investigate. Here’s a snapshot of what you’re really tracking:
| Metric | What It Tracks | The “So What?” |
|---|---|---|
| Click Latency & Pathing | The precise time and pixel-perfect path of your cursor. | Reveals hesitation patterns and optimal flick-shot angles. |
| Peak Performance Windows | Session length correlated with K/D, accuracy, and win rate. | Identifies your “golden hour” for critical matches or scrims. |
| Economy Efficiency | Gold/credit usage vs. value generated in subsequent rounds. | Flags wasteful buys and identifies your most cost-effective playstyle. |
| Fatigue & Consistency | Performance deltas between first and tenth match. | Highlights when you should take a break or switch to review. |
This isn’t just about playing more; it’s about understanding more. It’s the difference between a player who knows they lost a duel and a player who knows they lost it because their reaction time slows by 18% after 10 PM, as flagged by their esports analytics tools. The data doesn’t care about your excuse; it just shows you the jitter in your aim or the 0.2-second delay in your ability trade that cost you the clutch. It’s the ultimate, brutally honest coach that never gets tired of reviewing the tape.
Applying insights to practice
You’ve looked at heatmaps and K/D spreadsheets, and felt the sting of “First Deaths in Rounds Won.” But here’s the truth: raw data is just trivia unless it changes your actions. Your analytics dashboard is a tool, not a trophy for your ego. The numbers don’t lie, but they don’t act on their own.
The gap between knowing your win rate and improving it is where most players get stuck. The diagnosis is only as good as the action that follows. It’s time to move from being a spectator to the architect of your own growth.
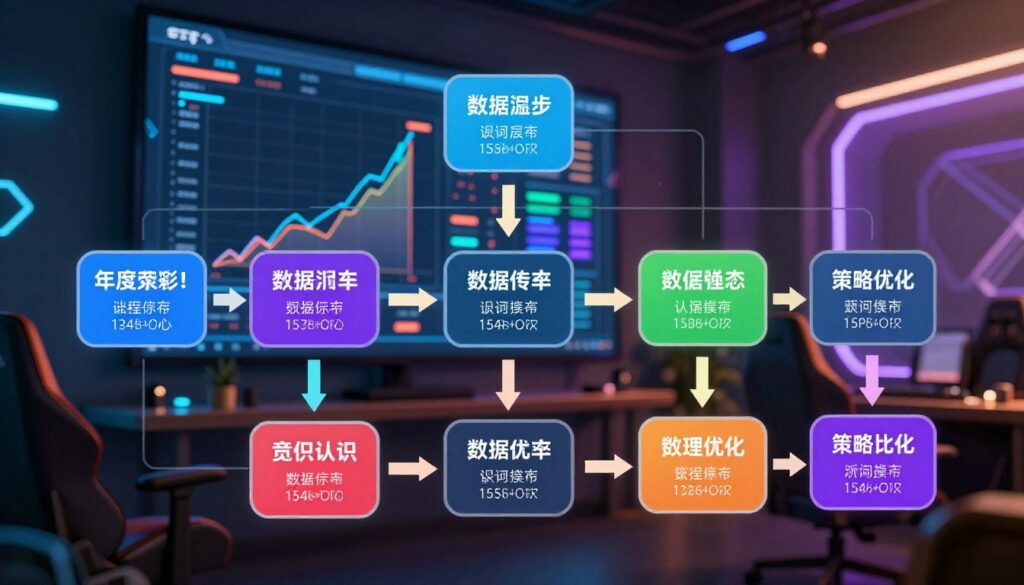
The Framework: From Dashboard to Drills
Think of your gaming analytics as an X-ray. It shows the break, but it doesn’t fix it. The data is the “what.” Your practice is the “how.” The goal is to link a data point to a physical action.
From Analysis to In-Game Results
An AI flagging “economy mismanagement” is a to-do list, not a criticism. If your gaming analytics show you’re losing credits, the drill is to practice budgeting. The data finds the problem; the drill fixes it.
Consider the utility damage stat. A low score means you’re not using your utility well. The drill is to practice your grenade lineup until it’s second nature. You’re not just practicing; you’re fixing a weakness.
| Data Point (The Symptom) | Diagnosis | Drill Prescription | Success Metric |
|---|---|---|---|
| Low Utility Damage | Ineffective grenade usage, poor lineup knowledge. | 15 min/day in a utility training map. Practice 3 key smoke, flash, or molotov lineups for your main maps. | Utility damage per round increases by 20% over 2 weeks. |
| Poor First-Bullet Accuracy | Crosshair placement and initial flick are off. | 10 min/day on a static aim trainer, focusing on micro-flicks to the head, followed by 5 min of tracking. | First-bullet headshot % in Deathmatch increases by 15%. |
| High Deaths on Entry | Over-peeking or poor clearing of angles. | 15 min/day in a pre-fire map, focusing on “slicing the pie” and clearing common pre-aim spots. | First death in a round decreases by 30%. |
The table is your new practice guide. It’s not about playing more. It’s about playing with purpose. The Sage’s advice? Track your drill completion, not just your win rate. Your gaming analytics show you the “what.” Your drills are the “how.” You’re now a strategist, using analytics to improve.
Limits of analytics
Data has changed the game, but humans are the ones playing. Our tools give us a great view, but they can’t see everything. They show us the path, but not the players’ true spirit.
The Intangible Edge
You can track every shot, but can’t measure heart. The game-winning three-pointer or a tackle that saves the game can’t be captured by numbers. Advanced analysis of team voice comms can show morale, as seen in a recent sports analytics analysis. But it’s not the same as feeling the fire in a player’s belly.
The “clutch factor” and team chemistry are hard to measure. They are the things that make a team truly great.
When Data Isn’t Enough
Our tools can spot a player’s weakness under pressure, but can’t measure their will to overcome it. The winning play often surprises even the best models. This is a lesson in humility: analytics are powerful, but not all-knowing.
The athlete who relies too much on data can get lost in the numbers. True strategy uses these tools to guide, not replace, the instincts and determination that win games. The future of analytics is not just in better numbers, but in understanding their limits.